

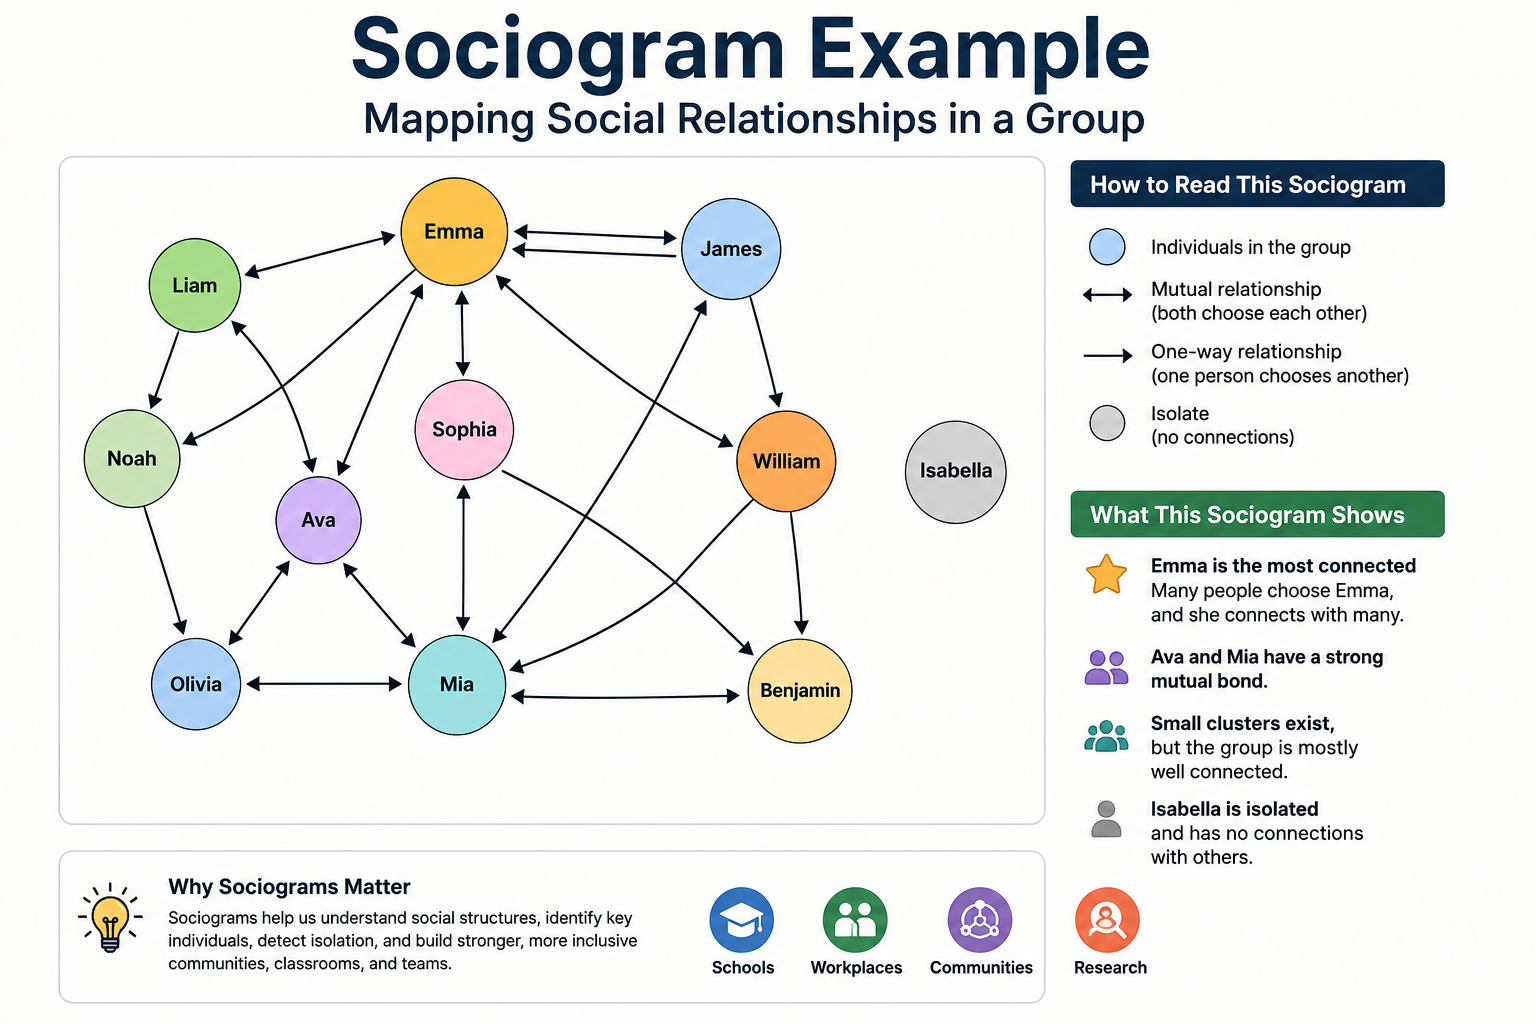
Human relationships are rarely simple. In any classroom, workplace, or community group, there’s an invisible web of friendships, alliances, and sometimes tension running underneath the surface. A sociogram is one of the few tools that makes this invisible web visible. By looking at real sociogram examples, you can start to see exactly how connections form, who holds influence, and who might be struggling to fit in.
This guide walks through what sociograms are, how they work, and how different sociogram examples are used across classrooms, workplaces, and research settings. Whether you’re a teacher, a manager, or simply curious about social dynamics, understanding these diagrams can change how you interpret group behavior.
Understanding Sociograms and Why They Matter
A sociogram is a visual diagram that maps out relationships between individuals in a group. It was originally developed by psychologist Jacob Moreno in the 1930s as part of his work in sociometry, a method for measuring social relationships. Moreno wanted a way to represent friendship patterns, popularity, and rejection without relying purely on written descriptions.
The core idea is simple. People are represented as points or shapes, usually circles for one gender and triangles for another in older academic models, though modern versions often skip that distinction entirely. Lines connect the points to show relationships, and the direction or thickness of those lines can indicate the strength or type of connection.
What makes sociograms so useful is that they turn abstract social information into something you can actually look at and analyze. Instead of trying to remember who gets along with whom, you have a diagram that lays it all out. This is why sociogram examples show up so often in education, psychology research, and even corporate team-building exercises.
What a Sociogram Actually Shows
At its most basic, a sociogram answers a few key questions. Who is well-liked within the group? Who tends to be isolated or overlooked? Are there small cliques or subgroups forming? Is there one person who seems to connect everyone else together?
These questions matter because social structure affects performance, wellbeing, and cohesion. In a classroom, a student who is socially isolated may struggle academically even if they’re capable, simply because they lack peer support. In a workplace, a team with tight cliques and no cross-group communication may face collaboration problems that no amount of process improvement will fix.
When you study sociogram examples, you’ll notice a few recurring roles. There’s usually a “star,” someone chosen frequently by others as a friend or preferred collaborator. There are “isolates,” individuals who receive few or no connections. There are also “mutual pairs,” two people who consistently choose each other, and sometimes “chains,” where individuals are connected indirectly through a string of relationships rather than direct ones.
Common Types of Sociogram Examples
Not all sociograms look the same, and the format often depends on what question is being asked. Some of the most common sociogram examples include target sociograms, where the most popular individuals sit at the center of concentric circles and less connected individuals sit farther out. This layout makes popularity and social distance immediately visible.
Another common format is the free-form sociogram, where individuals are placed anywhere on the page and lines are drawn based on survey responses, such as “who would you like to sit next to” or “who do you go to for advice.” This style is flexible and works well for smaller groups.
There are also directional sociograms, which use arrows instead of plain lines to show whether a relationship is mutual or one-sided. If two people both name each other, the arrow points both ways. If only one person names the other, the arrow points in a single direction. This distinction is important because mutual friendships behave very differently from one-sided admiration or one-sided rejection.
Looking at different sociogram examples side by side helps illustrate how the same group of people can appear completely different depending on the question asked. A group might look tightly connected when the question is about who they enjoy talking to, but far more fragmented when the question shifts to who they trust with sensitive information.
How Teachers Use Sociogram Examples in the Classroom
Teachers were among the earliest and most consistent users of sociograms, and that hasn’t changed. A classroom is a naturally occurring social environment, and understanding its structure can help teachers make better decisions about seating, group projects, and behavioral interventions.
By collecting simple survey data, such as asking students who they’d like to work with on a project, a teacher can build a sociogram that reveals hidden social dynamics. It might show that a seemingly quiet student is actually well-liked but simply reserved, or it might reveal that a student who seems fine on the surface is being consistently excluded by peers.
Many classroom sociogram examples are used specifically to identify students at risk of social isolation. Early identification allows teachers to intervene before the isolation affects self-esteem or academic performance. Sociograms are also used to design more balanced group work, ensuring that no group is made up entirely of isolates or that no single group monopolizes all the popular students.
It’s worth noting that sociograms should be handled carefully in educational settings. The results can be sensitive, and sharing them publicly could cause harm. Most teachers use sociogram data privately, as a planning tool rather than something displayed to the class.
Sociogram Examples in Workplace and Team Settings
Outside of education, sociograms have found a strong home in organizational psychology and team management. In a workplace, understanding the informal network of relationships can be just as important as the formal org chart. Two employees might be on different teams according to the company structure, yet collaborate constantly and trust each other’s judgment more than anyone else in their assigned department.
Workplace sociogram examples often focus on communication patterns rather than friendship alone. Questions like “who do you go to when you need quick technical help” or “who do you rely on for feedback before a big presentation” produce diagrams that reveal informal leaders, communication bottlenecks, and underused talent.
These diagrams are particularly useful during organizational change, such as mergers or restructuring. Leaders can use sociogram data to understand which relationships are critical to preserve and which teams might struggle with new reporting lines because their natural collaboration patterns don’t match the new structure.
Human resources teams sometimes use sociograms to spot signs of exclusion or workplace conflict early, before they escalate into formal complaints. A sociogram showing a consistently isolated employee, for instance, can prompt a manager to check in and offer support.
Reading the Symbols and Patterns
Interpreting a sociogram takes a bit of practice, but the underlying logic is consistent once you know what to look for. Circles or squares represent individuals. Lines or arrows represent relationships, and their direction tells you whether a connection is mutual or one-directional.
Clusters of tightly interconnected points usually indicate cliques, or subgroups that interact mostly within themselves. A single point with many incoming lines but few outgoing ones often represents a popular or influential figure. A point with no lines at all represents someone isolated from the rest of the group.
When comparing sociogram examples across different contexts, pay attention to density. A dense sociogram, with lots of overlapping connections, suggests a highly interconnected group where information and influence travel quickly. A sparse sociogram, with few connections and several isolated points, suggests a fragmented group that may need intervention to improve cohesion.
It also helps to look at reciprocity. Groups with mostly mutual connections tend to have healthier, more stable social dynamics than groups where most relationships are one-sided. One-sided admiration or one-sided avoidance can be early signs of social hierarchy issues or unresolved tension.
How to Create Your Own Sociogram
Building a sociogram doesn’t require specialized software, though diagramming tools make the process much faster and cleaner. The process usually starts with a simple survey. Participants are asked one or two clear questions, such as who they prefer to work with or who they trust for advice.
Once responses are collected, each person becomes a node on the diagram. Lines are drawn according to the survey answers, with arrows if the direction of the relationship matters. From there, patterns start to emerge naturally as you arrange the nodes to minimize crossing lines and group closely connected individuals near each other.
Many people find it easier to study existing sociogram examples before attempting their own, since seeing how professionals lay out clusters, stars, and isolates gives a much clearer sense of best practices than starting from a blank page. Digital diagramming tools also allow for color coding, which can add another layer of meaning, such as marking different departments, friend groups, or survey questions with different colors.
Common Mistakes to Avoid
One frequent mistake is asking vague survey questions. If participants aren’t sure what they’re being asked, such as a general “who do you like,” the resulting sociogram can be misleading. Specific, behavior-based questions tend to produce more accurate and actionable results.
Another common issue is overcrowding the diagram. Trying to map too many people at once, especially in a free-form layout, can make the sociogram unreadable. Breaking large groups into smaller sub-diagrams, or using a target format to organize by connection strength, usually solves this problem.
Privacy is also frequently overlooked. Because sociograms can reveal sensitive social information, especially about isolated or excluded individuals, they should be treated with the same care as any other confidential data. Publicly displaying a sociogram, particularly in a classroom, can do more harm than good.
Finally, it’s easy to over-interpret a single sociogram as a permanent picture of a group’s social structure. Relationships shift over time, and a sociogram is really just a snapshot. Reviewing sociogram examples collected at different points helps show how a group evolves, rather than relying on one static image as the full story.
Final Thoughts
Sociograms remain one of the most practical tools for understanding the social fabric of any group, whether that group is a classroom, a company, or a community organization. By studying real sociogram examples, you get a much clearer sense of how popularity, isolation, and influence actually play out in day-to-day interactions.
The value of a sociogram lies not just in the diagram itself, but in the questions it prompts you to ask afterward. Why is this person isolated? Why does information seem to flow through only one or two people? What would happen if that key connector left the group? These are the kinds of insights that make sociograms far more than a simple drawing exercise, and they’re exactly why sociogram examples continue to be used across so many different fields today.
