

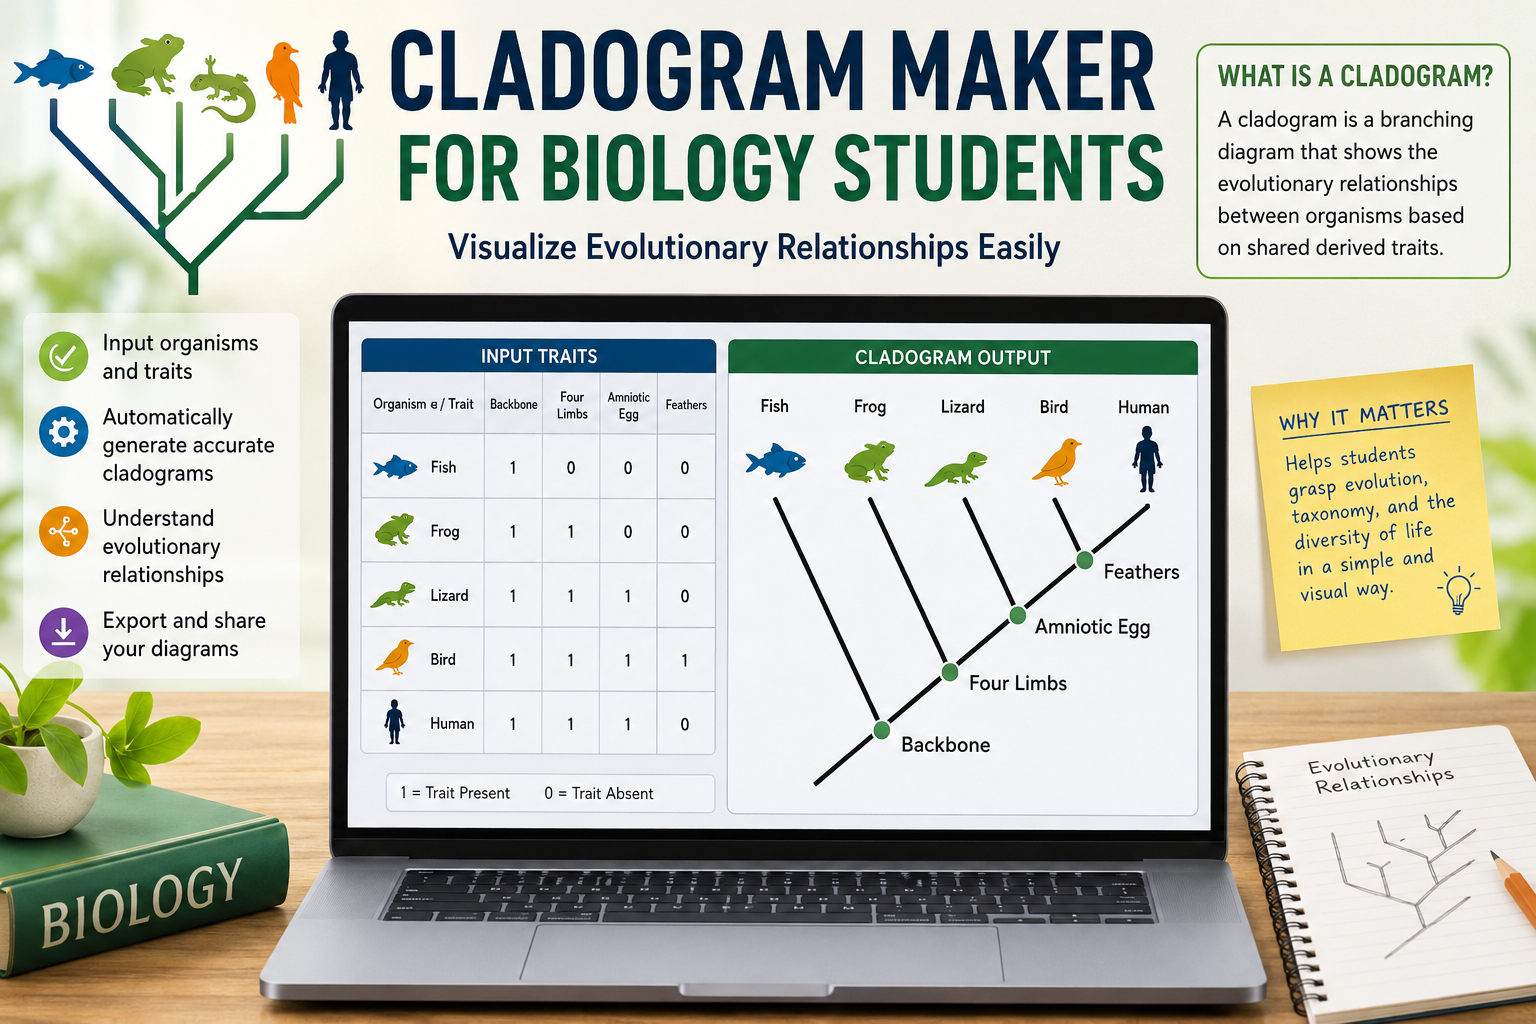
Cladogram Maker for Biology Students: A Complete Guide to Understanding Evolutionary Relationships
Biology students run into cladograms fairly early, usually while studying evolution, taxonomy, or comparative anatomy. At first glance, these branching diagrams look simple enough — a few lines connecting different organisms. But building one correctly, and reading it accurately, takes more thought than most students expect. This is exactly where a cladogram maker for biology students becomes useful, turning a task that once involved messy hand-drawn trees into something clear, organized, and far easier to understand.
This article walks through what cladograms are, why they matter in biology education, and how the right tool can make learning evolutionary relationships less confusing and more intuitive.
What Is a Cladogram and Why It Matters
A cladogram is a diagram that shows the evolutionary relationships between different species or groups of organisms based on shared characteristics. It doesn’t measure exact time or genetic distance the way a phylogenetic tree with branch lengths does. Instead, it focuses purely on branching patterns, showing which organisms share a common ancestor and how closely related they are compared to others.
Cladograms are built using shared derived traits, known as synapomorphies. If two organisms both have a particular trait that their common ancestor also had, they’re grouped together on the same branch. This branching logic is the foundation of cladistics, a method of classification that has become central to modern evolutionary biology.
Understanding cladograms isn’t just an academic exercise. It helps students grasp how scientists organize the diversity of life, how new species are classified, and how evolutionary history can be reconstructed from physical or genetic evidence. That’s a big reason why teachers introduce this concept early in biology courses.
Why Students Struggle With Building Cladograms by Hand
Drawing a cladogram manually sounds straightforward until you actually try it. Students need to compare multiple traits across several organisms, figure out which traits are shared and which are unique, and then arrange everything into a logical branching structure without contradictions.
Mistakes creep in easily. A student might place a branch in the wrong order, mix up ancestral and derived traits, or create a tree that doesn’t actually reflect the data table they were given. Erasing and redrawing lines by hand becomes tedious, especially when working with five or six organisms and a dozen traits.
This is where digital tools change the experience significantly. A cladogram maker for biology students removes much of the manual guesswork by letting learners input traits and organisms directly, then generating a clean, accurate diagram based on that data. It shifts the focus from the mechanics of drawing to the actual biological reasoning behind the tree.
What This Kind of Tool Actually Does
At its core, this kind of tool takes a set of organisms and their characteristics and converts that information into a visual branching diagram. Students typically enter a list of species along with the traits being compared — things like presence of a backbone, number of limbs, type of skin covering, or specific genetic markers.
Once the data is entered, the tool arranges the organisms based on shared traits, placing more closely related organisms on branches that split later in the diagram. This automated structuring is incredibly helpful because it shows students, almost instantly, what a correctly built cladogram should look like based on their own input.
A good cladogram maker for biology students also allows for edits and adjustments. If a student wants to test how the diagram changes when a trait is added or removed, they can make that change and immediately see the updated tree. This kind of experimentation is difficult to do with pencil and paper, but it’s simple with the right digital tool.
Key Features to Look For in a Cladogram Maker for Biology Students
Not every tool labeled as a diagram builder is actually well suited for classroom biology work. Some are built for general tree diagrams and lack the specific logic needed for cladistics. When evaluating options, a few features consistently make the biggest difference.
Ease of data entry matters a lot. Students should be able to list organisms and traits in a simple table format rather than fighting with complicated menus. The clearer the input process, the less time gets wasted on technical confusion instead of biology.
Accuracy in branch placement is equally important. The tool should apply consistent logic when organizing shared traits, so the resulting diagram genuinely reflects proper cladistic principles rather than just producing a random-looking tree.
Export and sharing options also matter for classroom use. Many students need to submit assignments or include diagrams in lab reports, so a tool that allows saving images or PDFs is far more practical than one that only displays results on screen.
Finally, a visually clean layout makes a real difference in comprehension. Cluttered diagrams with overlapping lines or unclear labels defeat the purpose of using a digital tool in the first place. A well-designed cladogram maker for biology students presents information in a way that’s easy to read at a glance, even for someone encountering the concept for the first time.
How This Tool Supports Classroom Learning
Teachers often use cladograms to teach broader concepts like natural selection, common ancestry, and taxonomic classification. When students can generate accurate diagrams quickly, class time shifts toward discussion and interpretation instead of getting stuck on drawing mechanics.
This also supports differentiated learning. Visual learners benefit from seeing the branching structure form in real time as traits are added. Students who struggle with abstract reasoning can experiment with different trait combinations and observe how the tree changes, which builds intuition in a way that static textbook diagrams often can’t.
Group work becomes easier too. Since digital diagrams can be shared, edited, and discussed collaboratively, students working in pairs or small groups can build a cladogram together, compare their reasoning, and correct mistakes as a team rather than working in isolation.
For homework and self-study, a cladogram maker for biology students offers a low-pressure way to practice repeatedly. Students can build several practice cladograms using different sets of organisms, checking their understanding without needing a teacher present for every attempt.
Reading and Interpreting a Cladogram Correctly
Building a cladogram is only half the skill; reading one correctly is just as important, and it’s a common area where students go wrong. Each point where a branch splits, called a node, represents a common ancestor shared by everything above that split.
Organisms that share a more recent node are more closely related than organisms that share only an older, more distant node. Students sometimes assume that species positioned physically closer on the page are automatically more related, but that’s not always true — what matters is the branching pattern, not the left-to-right arrangement.
Another common area of confusion involves reading a cladogram like a straight timeline. While branching does reflect the order in which traits evolved, cladograms don’t show exact dates or precise time spans unless specifically labeled. Recognizing this distinction helps students avoid misinterpreting the diagram during exams or lab assignments.
Common Mistakes Students Make When Building Cladograms
Even with a solid understanding of the theory, small errors are common. One frequent mistake is confusing ancestral traits with derived traits. Ancestral traits are present in the common ancestor and don’t help distinguish groups, while derived traits are the ones that actually define branching points.
Another mistake involves inconsistent trait application, where a student groups organisms based on one trait in one part of the diagram and a different trait elsewhere, creating a tree that doesn’t logically hold together. This usually happens when working with a large trait table by hand, since it’s easy to lose track of which comparisons have already been made.
Overcomplicating the tree is another issue. Some students try to include every possible trait at once, which results in a cluttered, hard-to-read diagram. Focusing on the most relevant, distinguishing traits usually produces a clearer and more accurate result.
Using a structured digital tool helps reduce these errors significantly. Because a cladogram maker for biology students organizes the input systematically, it naturally guides students away from inconsistent trait application and keeps the branching logic aligned with the data provided.
Choosing the Right Tool for Your Needs
With several tools available, choosing the right one comes down to matching the tool to the student’s actual needs. Younger students or those just being introduced to the concept usually benefit from simpler tools with minimal setup, where the focus stays on understanding basic branching logic.
More advanced students, especially those working with larger data sets or preparing for exams involving multiple organisms and traits, may need a tool that supports more complex inputs while still keeping the output visually clear.
Cost and accessibility also play a role. Since these tools are often used in classroom settings, free or low-cost options with straightforward interfaces tend to be more practical than complicated software requiring extensive setup or specialized training.
Ultimately, the best cladogram maker for biology students is one that makes the underlying biology easier to grasp, not one that adds unnecessary complexity. The tool should support learning rather than becoming another subject students have to figure out on top of the actual science.
Final Thoughts
Cladograms play an important role in how biology students understand evolutionary relationships, and the process of building them teaches valuable reasoning skills about shared traits and common ancestry. While hand-drawn diagrams have their place, digital tools have made this learning process far more accessible and far less frustrating.
A well-chosen cladogram maker for biology students turns a potentially confusing exercise into a clear, hands-on way to explore how species are related. By removing the mechanical difficulty of drawing accurate branches, these tools let students focus on what actually matters — understanding the biological reasoning behind every split in the tree.
